Collect Diagnostics from Porter
Porter can generate two types of data to assist with diagnostics and troubleshooting:
Logs
Porter can be configured to write logs to the PORTER_HOME/logs directory, for example ~/.porter/logs. Each time a Porter command is executed, a new log file is created, formatted in json, containing all the logs output by the command. The log lines are filtered by the current log level.
The name of each log file is the command’s correlationId which can be used to find the trace for the command executed in the configured telemetry backend. See Log Settings for details on how to configure logging.
Telemetry
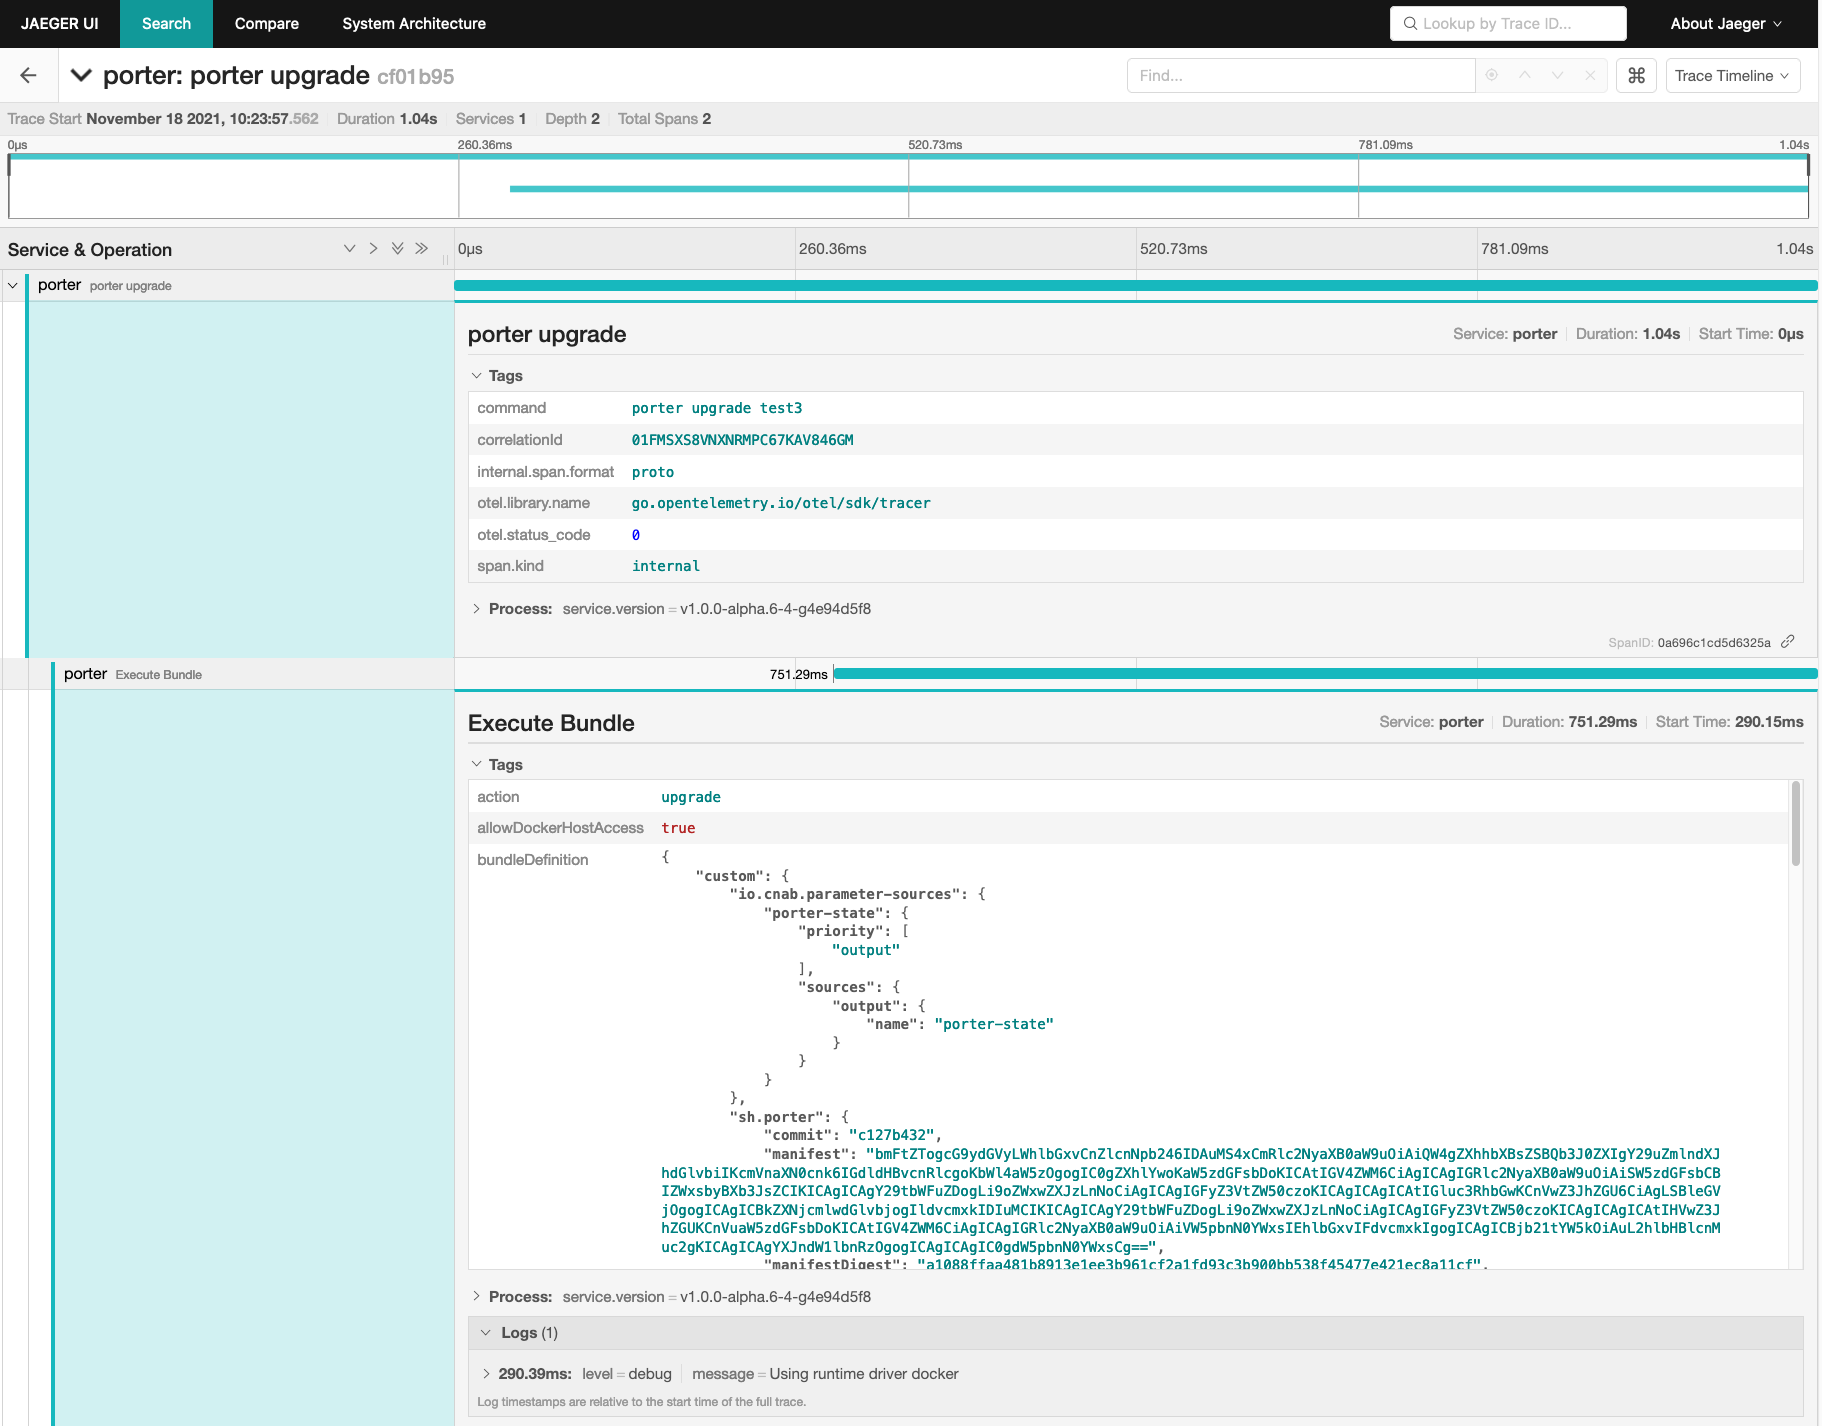
Porter is compatible with the OpenTelemetry specification and generates trace data that can be sent to a compatible services. Porter automatically uses the standard OpenTelemetry environment variables to configure the trace exporter.
Below is an example trace from running the porter upgrade command. You can see timings for each part of the command, and relevant variables used.
If you are running a local grpc OpenTelemetry collector, for example with the otel-jaeger bundle, you can set the following environment variables to have Porter send telemetry data to it. The environment variables below enable telemetry, and use standard OpenTelemetry environment variables to point to an unsecured grpc OpenTelemetry collector.
- PORTER_TELEMETRY_ENABLED: true
- OTEL_EXPORTER_OTLP_PROTOCOL: grpc
- OTEL_EXPORTER_OTLP_ENDPOINT: 127.0.0.1:4317
- OTEL_EXPORTER_OTLP_INSECURE: true
See Telemetry Settings for all the supported configuration settings.